Tools
The tools presented below represent a portion of the tools available for the climate, agriculture and forestry sectors. The tools range from specialized calculators to maps, models and datasets estimating a variety of outputs (e.g., crop production, greenhouse gas flux, and species distribution). Certain tools may be more relevant to land managers to aid in year-to-year decision-making, while others are more useful for researchers studying agriculture and climate change. Keep in mind that all tools have limitations and make assumptions that may not be appropriate for an entity’s climate/region/crop/soil type. USDA does not endorse the tools presented below. The tool list is provided for informational purposes only, and is not exhaustive.
-
Forest Health Advisory System
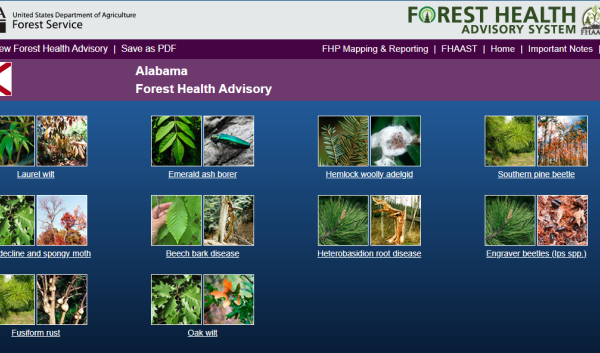
The Forest Health Advisory System (FHAS) provides a snapshot of U.S. forests and the susceptibility of their trees to major forests pests (insects and diseases) through the year 2027. It is based on the 2013 - 2027…
-
Drought.gov Data and Map Viewer
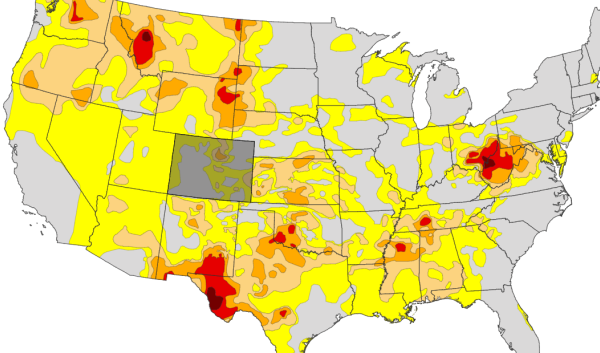
The Drought.gov Data and Map viewer is a collection of tools, maps and data at different scales on a variety of categories such as agriculture, fire, soil moisture, water supply and more.
-
NOAA Climate Monitoring
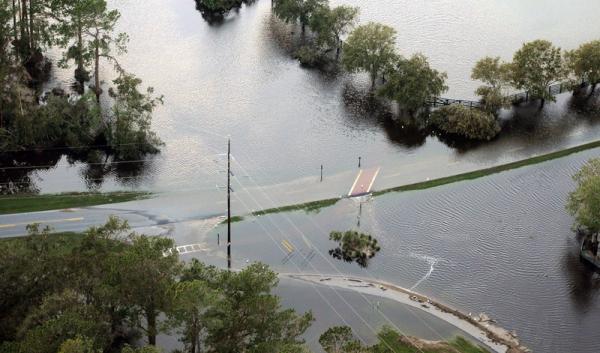
A webpage that provides climate information at multiple scales and across multiple variables, such as temperature, precipitation, and drought. The webpage includes State of the Climate, Climate at a Glance, Monthly…
-
Planting Population Calculator
The Ag PhD Planting Population Calculator aids in determining planting population and stand counts for the crops (corn and soybeans) on your farm.
-
PINEMAP Decision Support System

The PINEMAP decision support system (DSS) is a map-based collection of climate and forest productivity web tools designed to provide region-wide information on likely future climate risks, opportunities, and impacts on…
-
PastureMap

PastureMap is a grazing management and cattle record keeping software that includes season forecasting and scenario planning, calculations of stocking and carrying capacity, tracking of pastures and cattle, and…
-
NOAA Sea Level Rise Viewer
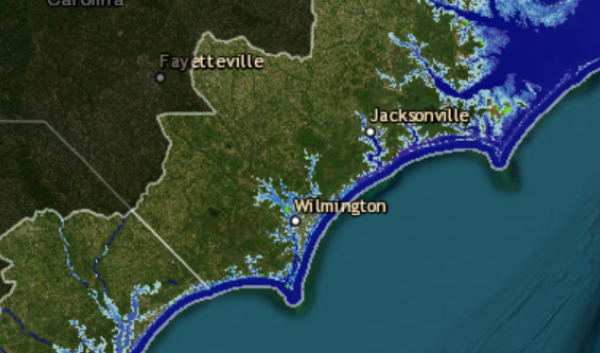
This web mapping tool visualizes ecological and community-level impacts from coastal flooding or sea level rise (up to 10 feet above average high tides).
-
National Insect and Disease Risk Map

The 2013-2027 NIDRM is a nationwide strategic assessment and database of the potential hazard for tree mortality due to major forest insects and diseases. The goal is to summarize landscape-level patterns of potential…


