Image

Image Credit
Native Climate
Image Caption (short)
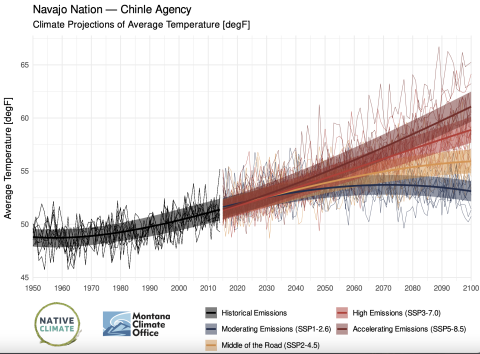
A projection showing average annual temperature from 1950-2100 for the Navajo Nation’s Chinle Agency

An official website of the United States government
Here's how you know
Official websites use .gov
A .gov website belongs to an official government organization in the United States.
Secure .gov websites use HTTPS
A lock (
) or https:// means you’ve safely connected to the .gov website. Share sensitive information only on official, secure websites.
